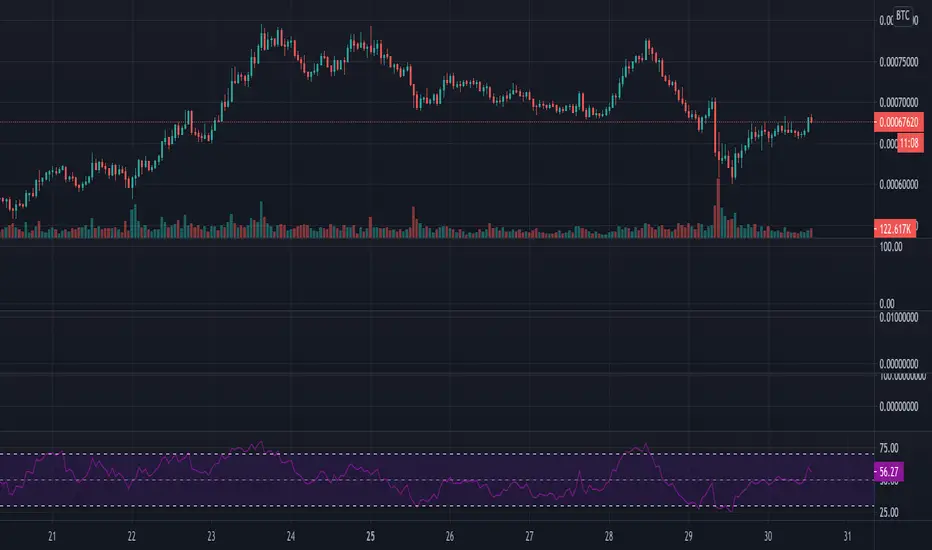
RSI by JBTRelative Strength Index With Alerts. With an upper band of crossing over 62 (RSI) and a lower band with a Triger price of 32 (RSI), This saves time and effort in waiting for the price to move above the desired level.
Cerca negli script per "relative strength"
Relative Strength Index modifierJ'ai rajouter quelque ligne pour les ventes et achat pour notre stratégie


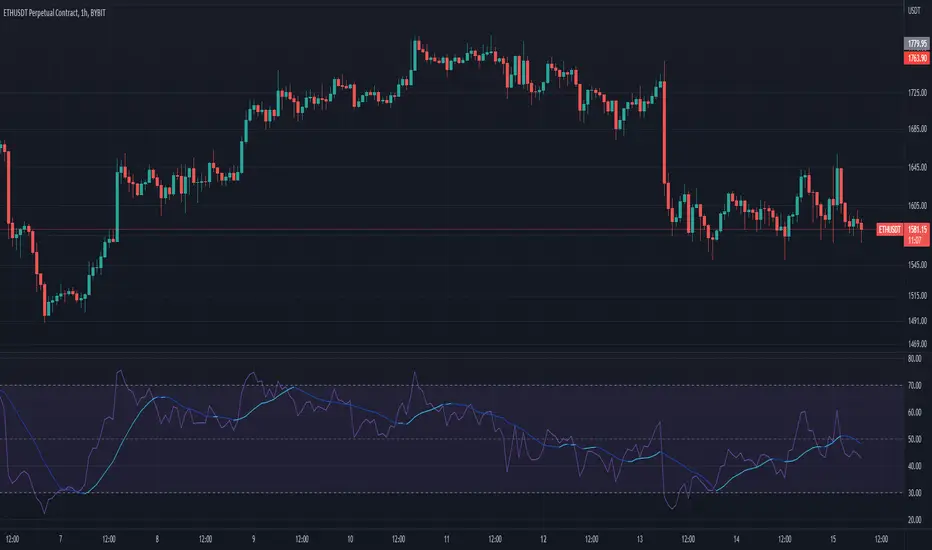
Relative Strength Index ColoredThis is a slight nuanced version of the RSI that adds color to the RSI MA based on the slope. This makes it easier to see a potential direction.
Relative Strength Index 2 buy a sellThis is my tool, I wanted to publish it so that my friend can easily find my tool
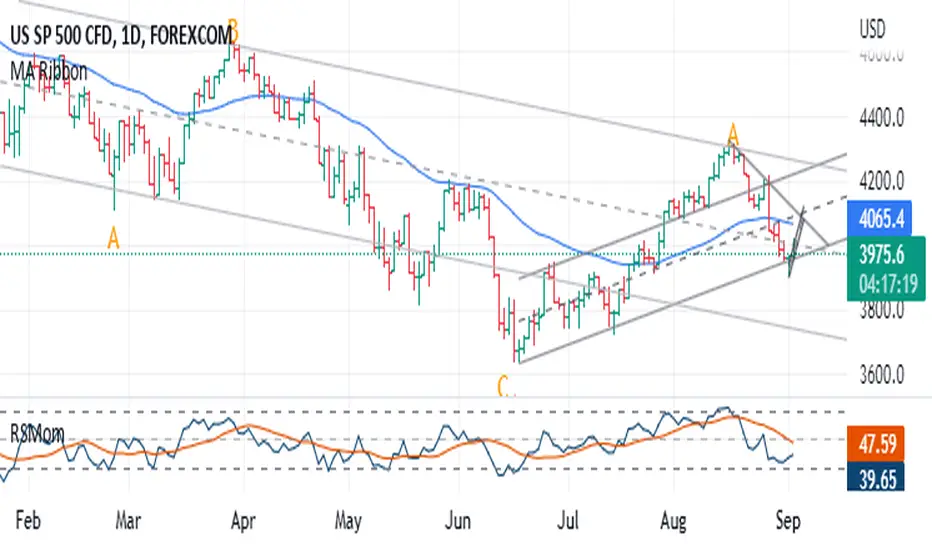
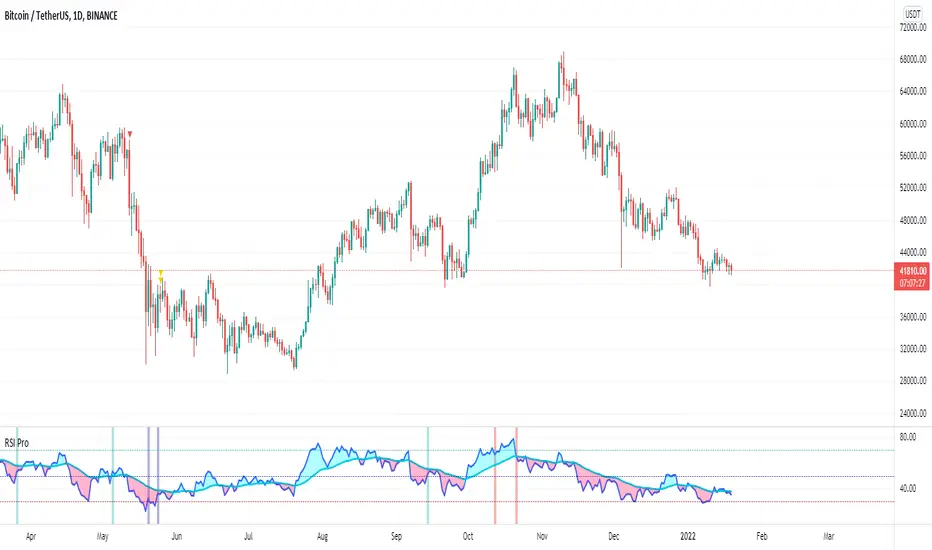
Relative Strength MomentumThe RSI is a traders friend - it can provide insight that other indicators simply cannot. The RSI achilles heel is that it can often fail to highlight divergence. Constance Brown attempted to resolve this problem with the 'Composite index' - a powerful tool. However.. for me, looking at two indicators can get a bit much - especially if viewing multiple time-frames. I want one tool which provides the RSI, it's ranging/reversal behaviour (as documented by Andrew Cardwell) and a better grasp of momentum swings (via divergence and reversal signals). So this is my best effort, and I hope it can prove useful to some of you. At first the differences may be hard to spot - but they are there!
My default settings are optimised - as with the 'normal' RSI you can expect a bullish trend to result in few (if any) moves below 30. In a bearish trend, you can expect few (if any) incursions above 70. Cardwell's observations apply. I recommend using this with a 50 period EMA to provide some additional context.
Yasir Hameed Advance RSI IndicatorRELATIVE STRENGTH INDEX ( RSI )
This is a tool that is widely used
Especially for Overbought and Oversold systems, but I have made some changes in this indicator,
How to use it...!
I have set it as the default setting
- RSI Length: 7
- Overbought: 70
- Oversold: 30
What is unique about this tool?
we can see 3 conditions:
1) RSI Overbought / Oversold with Bullish Engulfing / Bearish Engulfing
2) RSI Overbought / Oversold with Hammer and Shooting Star
3) RSI Overbought / Oversold with 2 Bullish Bars / 2 Bearish Bars
4) RSI Overbought / Oversold with All Patterns at the same time
When the RSI reaches its Oversold line, the code will wait for Bullish Engulfing pattren, when oversold and Bullish engulfing matched, This indicator will generate a buy signal when the condition is met,
and same as for Bear market, When the RSI reaches its Overbought line, the code will wait for Bearish Engulfing pattren, This indicator will generate a sell/exit signal when the condition is met,
2nd condition is that a Hammer candle will be waited for when RSI touches the Overbought line, for Bullish Move
and Shooting Star candle will be waited for when RSI touches the Overbought line, for Bullish Move, for Bearish Move
3rd Condition is also the same as Condition 1 and Condition 2,
When the RSI reaches its Oversold line, the code will wait for 2 Bullish Bars, when oversold and 2 Bullish Bars matched then this indicator will generate a buy signal, and same as for Bear market,
When the RSI reaches its Overbought line, the code will wait for 2 Bearish Bars, when overbought and 2 Bearish Bars matched then this indicator will generate a Sell signal,
4th Condition is that we can use All Conditions at the same time,
- Bullish Engulfing / Bearish Engulfing
- Hammer and Shooting Star
- 2 Bullish Bars / 2 Bearish Bars

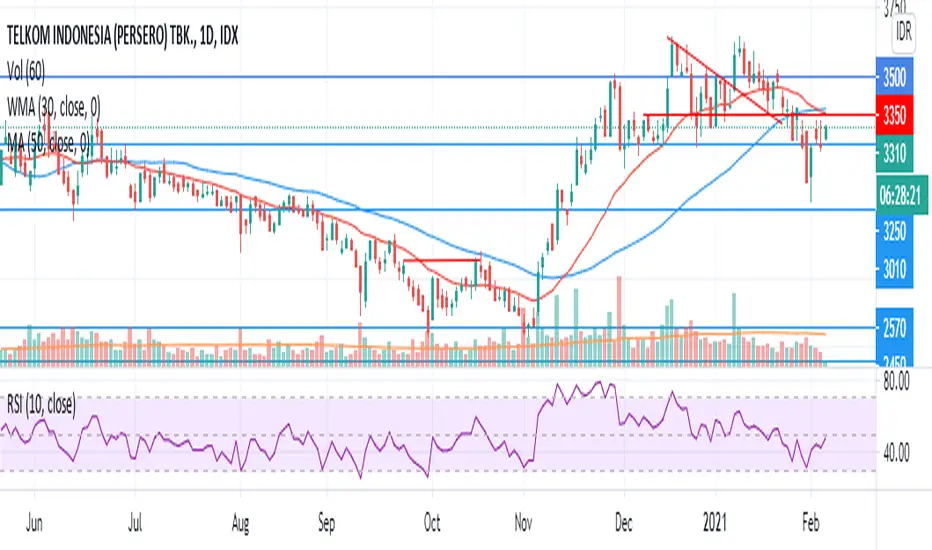
RS Compare IndicatorRelative Strength Breakout is always a great indicator of change in trends. This indicator is a visual attempt to show the region of outperformance of a stock with respect to a sector or primary indicator.
The color indicated should read as below
1) Color Red: Indicates that the selected script is underperforming the indexing with which it is compared
2) Color Yellow: Indicates that the selected script is as per the indexing with which it is compared.
3) Color Green: Indicates that the script is outperforming the indexing with which it is compared.

Relative Strength Index - Divergences - LibertusHello all,
To ease everyone's trading experience I made this script which colors RSI overbought and oversold conditions and as a bonus displays bullish or bearish divergences in last 50 candles (by default, you can change it).
Script is open source, part of code is from Trading View examples. If you have suggestions or you already made some improvements, please report in comment.
Happy trading and good luck!

Relative Strength Index (OSC)Hello everyone, I'm sorry that the previous open-source version was hidden due to the house rules, I've re-edited the description and re-posted it
(1) Indicator introduction
This is RSI indicator with original divergence algorithm
This indicator is plotted on the RSI and can display the divergence locations and corresponding divergence intensity
The tolerance of N Klines at the top or bottom positions for price and indicator is supported, which is set by the "Tolerant Kline Number"
Support the display of divergence intensity, that is, the REG/HID value displayed on the label, which is less than 0. The smaller the intensity value, the more obvious divergence
Support the filtering of divergence intensity, which is set by "Cov Threshold". The divergence that REG/HID divergence intensity greater than this value will be ignored
In the label, REG indicates regular top/bottom divergence while HID indicates hidden top/bottom divergence
In the label, SRC(x-y) indicates a divergence occurred from the x-th kline to the y-th kline
In the label, OSC(x-y) indicates a divergence occurred from the indicator corresponding to the x-th kline to the y-th kline
(2) Parameter introduction
- RSI Settings
Source: The source to calculate RSI, close by default
RSI Length: The length of RSI, 14 by default
- RSI Divergence
Pivot Lookback Right: Number of K-line bars recalling the pivot top/bottom point to the right
Pivot Lookback Left: Number of K-line bars recalling the pivot top/bottom point to the left
Max of Lookback Range: Maximum number of retracing K-line bars to find the pivot top/bottom point
Min of Lookback Range: Minimum number of retracing K-line bars to find the pivot top/bottom point
Tolerant Kline Number: Maximum tolerance in indexing top/bottom points of Klines and indicators
Cov Threshold: Divergence intensity, which is less than 0. The smaller the intensity value, the more obvious divergence
Plot Bullish: Whether to draw regular bullish divergence label
Plot Hidden Bullish: Whether to draw hidden bullish divergence label
Plot Bearish: Whether to draw regular bearish divergence label
Plot Hidden Bearish: Whether to draw hidden bearish divergence label
Happy trading and enjoy your life!
————————————————————————————————————————
各位朋友大家好,很抱歉之前的开源版本因为规则原因被隐藏,我已经重新编辑了说明并重新发布
(1) 指标说明
该指标绘制于 RSI 上,并在对应位置显示背离点以及背离程度
支持顶底位置 N 根K线的容差,由 Tolerant Kline Number 参数设置
支持背离强度的显示,即标签上显示的 REG/HID 值,该值小于 0,且越小说明背离程度越大
支持背离强度的过滤,由 Cov Threshold 参数设置, REG/HID 值大于这个值的背离会被忽略
标签中,REG 表示常规顶/低背离,而 HID 表示隐藏顶/底背离
标签中,SRC(x-y) 表示从当前第 x 根 bar 开始到第 y 跟 bar 出现背离
标签中,OSC(x-y) 表示从当前第 x 根 bar 所对应的指标开始到第 y 跟 bar 所对应的指标出现背离
(2) 参数说明
- RSI Settings
Source: 计算 RSI 指标的 source,默认为 close
RSI Length: 计算 RSI 指标的长度,默认为 14
- RSI Divergence
Pivot Lookback Right: 枢纽顶/底点往右回顾的 K线 bar 数量
Pivot Lookback Left: 枢纽顶/底点往左回顾的 K线 bar 数量
Max of Lookback Range: 回寻找枢纽顶/底点的最大回溯 K线 bar 数量
Min of Lookback Range: 回寻找枢纽顶/底点的最小回溯 K线 bar 数量
Tolerant Kline Number: K线和指标的顶/底点索引的最大误差
Cov Threshold: 背离程度,该值小于 0,且越小说明背离程度越大
Plot Bullish: 是否绘制常规底背离提示
Plot Hidden Bullish: 是否绘制隐藏底背离提示
Plot Bearish: 是否绘制常规顶背离提示
Plot Hidden Bearish: 是否绘制隐藏顶背离提示
祝大家交易愉快

Relative Strength Index (SRC)Hello everyone, I'm sorry that the previous open-source version was hidden due to the house rules, I've re-edited the description and re-posted it
(1) Indicator introduction
This is RSI indicator with original divergence algorithm
This indicator is plotted on the klines and can display the divergence locations and corresponding divergence intensity
The tolerance of N Klines at the top or bottom positions for price and indicator is supported, which is set by the "Tolerant Kline Number"
Support the display of divergence intensity, that is, the REG/HID value displayed on the label, which is less than 0. The smaller the intensity value, the more obvious divergence
Support the filtering of divergence intensity, which is set by "Cov Threshold". The divergence that REG/HID divergence intensity greater than this value will be ignored
In the label, REG indicates regular top/bottom divergence while HID indicates hidden top/bottom divergence
In the label, SRC(x-y) indicates a divergence occurred from the x-th kline to the y-th kline
In the label, OSC(x-y) indicates a divergence occurred from the indicator corresponding to the x-th kline to the y-th kline
(2) Parameter introduction
- RSI Settings
Source: The source to calculate RSI, close by default
RSI Length: The length of RSI, 14 by default
- RSI Divergence
Pivot Lookback Right: Number of K-line bars recalling the pivot top/bottom point to the right
Pivot Lookback Left: Number of K-line bars recalling the pivot top/bottom point to the left
Max of Lookback Range: Maximum number of retracing K-line bars to find the pivot top/bottom point
Min of Lookback Range: Minimum number of retracing K-line bars to find the pivot top/bottom point
Tolerant Kline Number: Maximum tolerance in indexing top/bottom points of Klines and indicators
Cov Threshold: Divergence intensity, which is less than 0. The smaller the intensity value, the more obvious divergence
Plot Bullish: Whether to draw regular bullish divergence label
Plot Hidden Bullish: Whether to draw hidden bullish divergence label
Plot Bearish: Whether to draw regular bearish divergence label
Plot Hidden Bearish: Whether to draw hidden bearish divergence label
Happy trading and enjoy your life!
————————————————————————————————————————
各位朋友大家好,很抱歉之前的开源版本因为规则原因被隐藏,我已经重新编辑了说明并重新发布
(1) 指标说明
该指标绘制于 K线 上,并在对应位置显示背离点以及背离程度
支持顶底位置 N 根K线的容差,由 Tolerant Kline Number 参数设置
支持背离强度的显示,即标签上显示的 REG/HID 值,该值小于 0,且越小说明背离程度越大
支持背离强度的过滤,由 Cov Threshold 参数设置, REG/HID 值大于这个值的背离会被忽略
标签中,REG 表示常规顶/低背离,而 HID 表示隐藏顶/底背离
标签中,SRC(x-y) 表示从当前第 x 根 bar 开始到第 y 跟 bar 出现背离
标签中,OSC(x-y) 表示从当前第 x 根 bar 所对应的指标开始到第 y 跟 bar 所对应的指标出现背离
(2) 参数说明
- RSI Settings
Source: 计算 RSI 指标的 source,默认为 close
RSI Length: 计算 RSI 指标的长度,默认为 14
- RSI Divergence
Pivot Lookback Right: 枢纽顶/底点往右回顾的 K线 bar 数量
Pivot Lookback Left: 枢纽顶/底点往左回顾的 K线 bar 数量
Max of Lookback Range: 回寻找枢纽顶/底点的最大回溯 K线 bar 数量
Min of Lookback Range: 回寻找枢纽顶/底点的最小回溯 K线 bar 数量
Tolerant Kline Number: K线和指标的顶/底点索引的最大误差
Cov Threshold: 背离程度,该值小于 0,且越小说明背离程度越大
Plot Bullish: 是否绘制常规底背离提示
Plot Hidden Bullish: 是否绘制隐藏底背离提示
Plot Bearish: 是否绘制常规顶背离提示
Plot Hidden Bearish: 是否绘制隐藏顶背离提示
祝大家交易愉快

Relative Strength Index JoaScript desarrollado para RSI
Modificado para una correcta entrada y salida de los mercados Cryptos
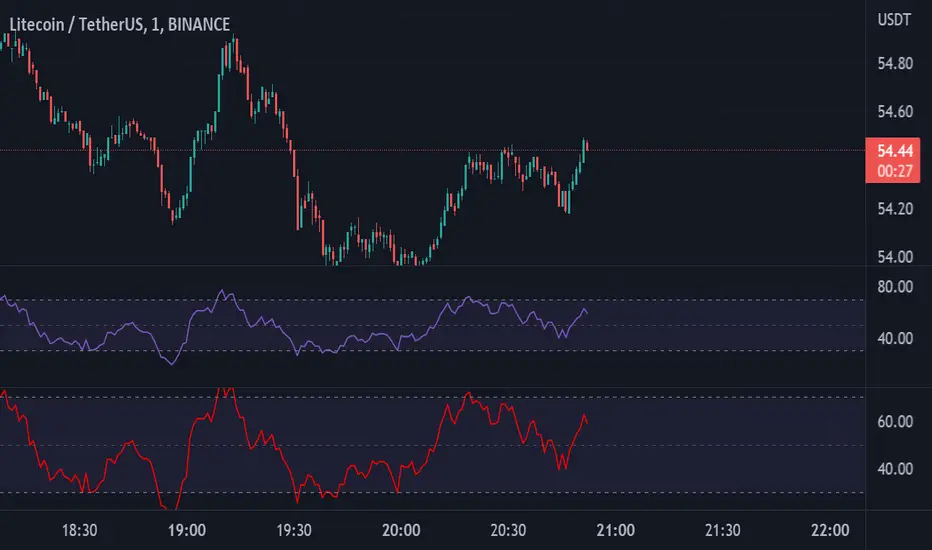
Relative Strength Index - Divergences, Stoch, Reverse StochThis is aggregation of RSI indicators - RSI, Divergences, Reverse & Stochastic RSI
Thanks to ©JayTradingCharts and ©mohanee for the RSI Divergences code
Thanks to BApig - Motgench, balipour and Wugamlo for the reverse stoch code
Changes:
1. Add option to calc divs based on close or wicks or both (RSI is close based)
2. Add pivots (marking local high/low)
3. Update to Pine v5
4. Cleanup of unused code

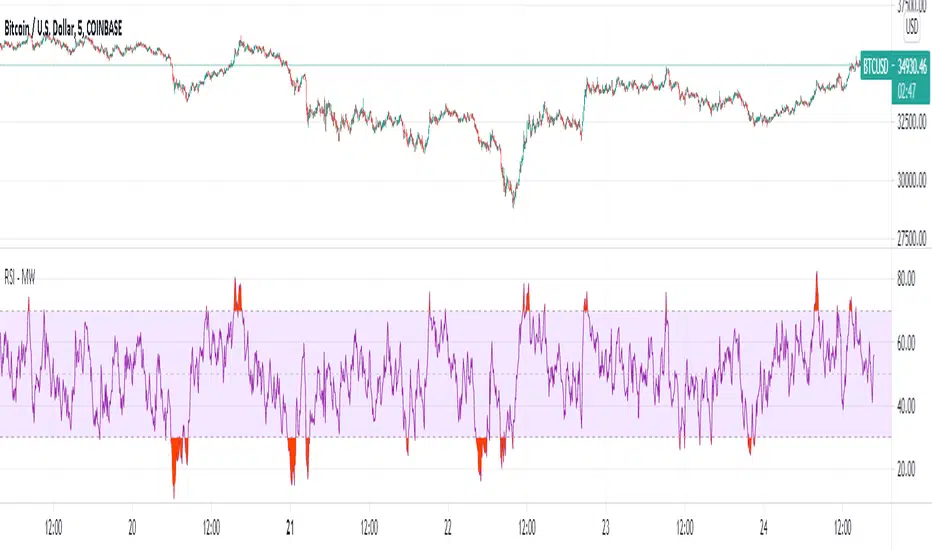
Relative Strength Index TOP and Bottom Circles with AlertsFind the top and bottom using the RSI, the red circle means overbought > 70 and the green circle means oversold < 30

Relative Strength Index with Range ShiftThis RSI implements the additional concept of "Range Shift" to accommodate speculative bias towards a Bullish, Strong Bullish, Bearish, or Strong Bearish outlook.
Select the range bias in the settings and get better color coded feedback from the indicator.

Relative Strength Index (RSI) - MotiveWave versionThis is an updated RSI version of the original RSI built-in indicator where the oversold and overbought areas are highlighted.
People who are familiar with MotiveWave, this RSI updated version has a similar look as the RSI indicator in MotiveWave.
Enjoy it!
RSI Signals by HBRELATIVE STRENGTH INDEX (RSI)
This is a tool that is widely used
Especially for Overbought and Oversold systems, but I have made some changes in this indicator,
How to use it...!
I have set it as the default setting
- RSI Length: 7
- Overbought: 70
- Oversold: 30
What is unique about this tool?
we can see 3 conditions:
1) RSI Overbought / Oversold with Bullish Engulfing / Bearish Engulfing
2) RSI Overbought / Oversold with Hammer and Shooting Star
3) RSI Overbought / Oversold with 2 Bullish Bars / 2 Bearish Bars
4) RSI Overbought / Oversold with All Patterns at the same time
When the RSI reaches its Oversold line, the code will wait for Bullish Engulfing pattren , when oversold and Bullish engulfing matched, This indicator will generate a buy signal when the condition is met,
and same as for Bear market, When the RSI reaches its Overbought line, the code will wait for Bearish Engulfing pattren , This indicator will generate a sell/exit signal when the condition is met,
2nd condition is that a Hammer candle will be waited for when RSI touches the Overbought line, for Bullish Move
and Shooting Star candle will be waited for when RSI touches the Overbought line, for Bullish Move, for Bearish Move
3rd Condition is also the same as Condition 1 and Condition 2,
When the RSI reaches its Oversold line, the code will wait for 2 Bullish Bars , when oversold and 2 Bullish Bars matched then this indicator will generate a buy signal, and same as for Bear market,
When the RSI reaches its Overbought line, the code will wait for 2 Bearish Bars , when overbought and 2 Bearish Bars matched then this indicator will generate a Sell signal,
4th Condition is that we can use All Conditions at the same time,
- Bullish Engulfing / Bearish Engulfing
- Hammer and Shooting Star
- 2 Bullish Bars / 2 Bearish Bars

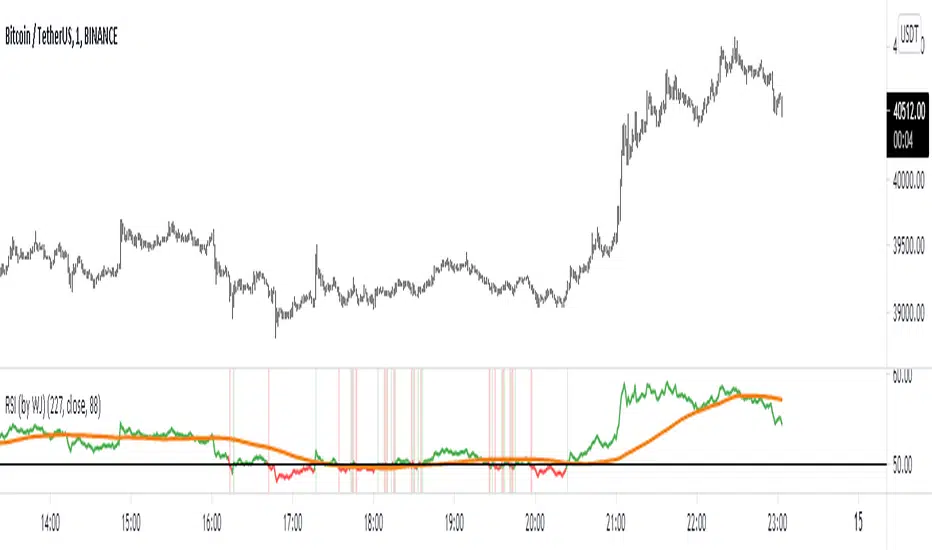
Relative Strength Index w/ 3 Levels & 0 Line Colour (by WJ)NOTE:
// RSI CODE TAKEN FROM DEFAULT INDICATOR
// I HAVE ONLY MADE SOME ADJUSTMENTS FOR VISUAL AID
// I MADE THIS FOR MY OWN USE BUT HAVE DECIDED TO PUBLISH AND SHARE IN CASE ANYBODY WANTS TO USE IT
This is the normal default built-in RSI indicator which I have added some stuff for visual aid:
Added middle line (50)
RSI turns green when crossed above 50
RSI turns red when crossed below 50
RSI background turns green and red on crossover candle based on whether RSI just crossed over or below 50 respectively
Alert notification on the crossover candle
Relative Strength Index; expertHow to use
Uptrend
Buy or Long on dip when RSI>50 or similar, RSI>Signal line and Divergence.
Downtrend
Short on dip(for a downtrend) when RSI<50 or similar, RSI
Relative Strength Index with overbought/oversold levelsThis indicator is same as standard RSI, but it marks overbought/oversold levels.

Relative Strength Index with Center LineNot the biggest of changes... I just added a center line to the standard RSI... Because I'm not sure why there isn't one in the original! RSI isn't just for overbought and oversold... It's value being above or below 50 can also indicate the trend!